Real-Time Monitoring of Data from Multiple Sensors on a Webpage using Node-RED
In this article, I will explain how to display real-time data from different sensors on a web page using Node-RED in a few easy steps. I will also cover how to save incoming real-time data on a 'csv' file. I will provide a link to the GitHub repository holding the source code (JSON script) at the end of the article so you don't have to worry about writing any lines of codes.
You can run Node-RED on pretty much any platform supported by Node-RED including your local computer, or single-board computers such as a Raspberry Pi or BeagleBone. So, please feel free to pick wherever you want to run Node-RED. For the purpose of this tutorial, however, I'm going to install Node-RED on Windows 10 on my computer. The content of this article applies to all platforms, so continue reading.
To keep my post short, I have avoided detailed explanations on how different components of Node-RED work, and instead provided link to some of the available resources.
Update: I have a complementary post to this one on "How to Display Wireless Sensor Data on a Webpage Using Node-RED and Raspberry Pi". The post provides additional information on obtaining sensor data wirelessly. There is also a post on "How to Setup a Wireless Monitoring System for Your Grow Room, Nursery, Orchard or Garden?".
List of Hardware You Will Need
Here's a list of the hardware you'll need to get started:
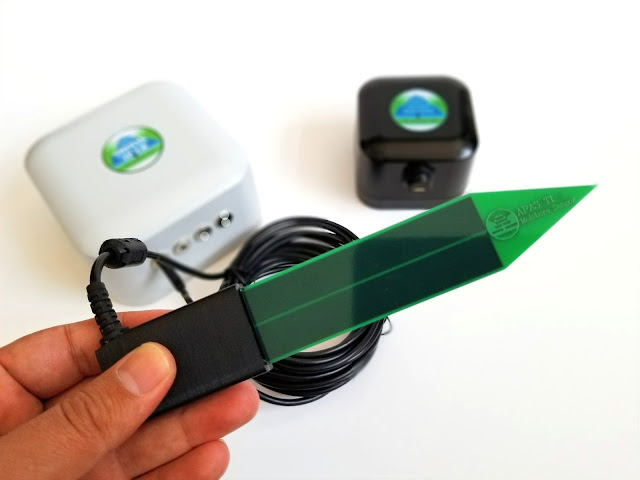
APAS T1 soil moisture and temperature sensor (x1)
HITA E0 EC/TDS and temperature sensor (x1)
AVAN Zero (x2) or ISHTAR Zero (x2) USB sensor adapter
You can find all three on our products page. An open-source DIY version of the AVAN Zero is shared in this blog post. Please read the post to learn how to assemble one for your own project and use with the sensors.
Connecting the Sensors
Here, I'm going to work with only two sensors, but by the time we reach the end of this tutorial you'll see that you can connect as many [USB] sensors as your hardware allows. For example, Raspberry Pi 3B+ allows reading up to eight USB devices connected to it simultaneously.
The AVAN Zero interface (and ISHTAR Zero) has a single sensor port. It automatically detects sensor type (only DurUntash sensors), takes sensor readings, carries out signal conditioning (e.g. calibration and temperature-compensation), formats the results in the form of comma-separated data string, and makes them available at its USB port every 5 s. This means the only thing you need to do is to connect each sensor to an AVAN Zero unit and connect the AVAN Zero to your computer or Raspberry Pi board (via its USB cable). The rest is done in Node-RED.
To learn more about the AVAN Zero and its communication protocol, please refer to its user manual. The ISHTAR Zero sensor adapter is identical to the AVAN Zero in terms of functionally and comes in a rugged wall/pole mount polycarbonate enclosure.
Getting started with Node-RED
This guide will help you get Node-RED installed and running in just a few minutes:
Running Node-RED on Microsoft Windows
This page gives specific instructions on setting up Node-RED in a Microsoft Windows environment. Please follow the instructions carefully. In my case, after finishing the installation of Node-RED and its dependencies, I had to take the following steps to open the editor and create a flow:
Open Windows PowerShell and type "node-red". Press "Enter".
With Node-RED running, open the editor in a web browser (URL: http://localhost:1880).
Create a Flow
The goal is to obtain real-time data from multiple sensors and and display them on Node-RED dashboard (explained later). As you know, Node-RED is a flow-based programming tool, so to do so we need to create a flow in the Node-RED editor. I will show you what we want to create (picture below) first and then explain the components.

As you can see in the picture, there are two separate [top and bottom] flows, which are identical for the most part. Each flow is responsible for obtaining readings from one AVAN Zero sensor interface. The top flow takes reading from the soil moisture sensor and the bottom flow from the EC sensor.

Each flow has four main tasks:
Connect to a COM/USB port (i.e. AVAN Zero).
Save real-time data strings into a "csv" file.
Parse data strings and extract temperature and soil moisture (or EC and TDS) data.
Direct sensor readings to the Node-RED dashboard for display.
To carry out the abovementioned tasks, we're going to need five node types:
serial in
file
function
gauge
chart
These nodes can be found in the palette section on the left hand side of the editor. If you can't find some of these nodes, don't panic! This means they aren't installed yet and you need to install them first. Go to the menu (right-top corner), click on the "Manage palette". Look for the node-group that you need and install it.
"Serial in" Node
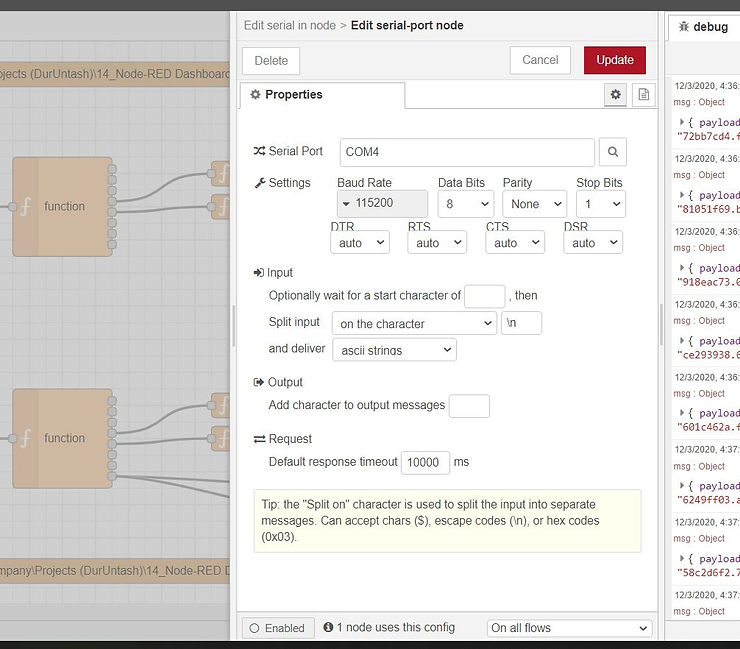
Each flow starts with "serial in" node. It can be found under "network" in the palette section. Double click the node to access the properties window, and then click edit. You'll see a variety of options. Here, you can choose which AVAN Zero unit to connect to. You only need to know the port number. If in doubt, simply plug the AVAN Zero in and out. The serial port that appears/disappears belongs to your device. Leave the rest of the settings unchanged.

"File" Node
By adding a "serial in" to the editor and activating it, pretty much most of the work is done, and we now have serial sensor data available at our disposal. These data can be saved on a "csv" file using a "file" node. You can find the file node under "storage" in the palette section. Drag the node to the editor and double click to access its properties. Don't forget to connect it to the "serial in" node.
As you can see in the tip section, "the filename should be an absolute path, otherwise it will be relative to the working directory of the Node-RED process". So, in front of the "Filename", put a name and location for the csv file to be saved. Action should be "append to file". "add newline (\n) to each payload" should be left unchecked because incoming serial data already contains a newline character.

"Function" nodes
Each flow has three function nodes. The first (bigger one) takes input serial data (data string) and split them into individual readings (eight), and put them into an array. In the soil moisture sensor flow (top), variables 4 and 5 provide soil moisture and soil temperature readings, respectively. In the EC sensor flow (bottom), variables 4, 5 and 8 provide EC, solution temperature and TDS readings, respectively.

These are still raw data and need to go through an additional stage of processing to become usable. This is done by the small function nodes.


"Gauge" and "Chart" Nodes
The last stage is to have sensor readings displayed using the Node-RED dashboard. This is done using the dashboard nodes. Here, we're using the "gauge" and "chart" nodes. The most important properties of these nodes is "Group". I will give each dashboard node a meaningful name/title (e.g. Soil Moisture (%) or Soil Temperature (°C)) and put all the nodes under the "Home" tab.


Finalizing the Flows
After creating the soil moisture sensor flow (by placing all the nodes in the editor, connecting them and editing their properties), repeat the same steps to create the EC sensor flow. Please note that the later flow has minor differences with the previous one: there are two additional dashboard nodes that are used to display TDS (total dissolved solids). You also need to choose a different name for EC sensor data csv file.
Note: If you have additional sensors, simply duplicate the corresponding flow (i.e. soil moisture or EC) and change the "serial in" node properties to match the additional serial/USB port.
Node-RED Dashboard
Click the "Deploy" button to apply all the changes and deploy the flows. Now it's time to go to the Node-RED dashboard and monitor real-time sensor data. To access the dashboard simply type http://localhost:1880/ui in your browser. You'll see the dashboard below:

Congratulations! You have made your Node-RED dashboard to display real-time data from multiple sensors.
Download
I have put the zipped JSON file for the flow that was discussed here on GitHub. After downloading the file, take the following steps to access and use the JSON file:
Unzip the file.
Open Node-RED editor.
Navigate to the menu (top-right corner) and click "Import".
Select the JSON unzipped file to import. A new flow page will open.
Modify and use the flows as you wish.
Please feel free to leave your comments in the comments section below should you have any questions.


Comments
Post a Comment